What is an Infographic Poster?
Infographics are great for presenting complex information in a way that’s easy to understand and visually appealing.
But, what is an infographic?
An infographic is a type of graphic design that combines text, images, and data to present information in a way that is both informative and engaging.
The goal of an infographic is to communicate information quickly and clearly, often using charts, graphs, and other visual aids.
Whether you are looking to convey complex data or tell a compelling story, an infographic can be a valuable tool in your communication arsenal.
In this article, we’ll discuss:
- What is an infographic
- Why you should use infographics
- Impact of Infographics
- Examples and uses
- Best practices for creating a compelling design
- How to create an infographic
- Different types
So, let’s dive in.
What is an Infographic?
An infographic is a visual representation of information, data or knowledge. It is a combination of text, images, and graphics that presents complex information in a clear and concise way.
Infographics are used to convey information in a way that is more engaging than traditional text-based formats.
Often used in marketing, social media, and educational contexts, infographics can be used to explain complex concepts, showcase statistics, or tell a story.
Designed to be visually appealing and easy to read, they often use bold colours, eye-catching graphics, and clear typography to draw the viewer’s attention.
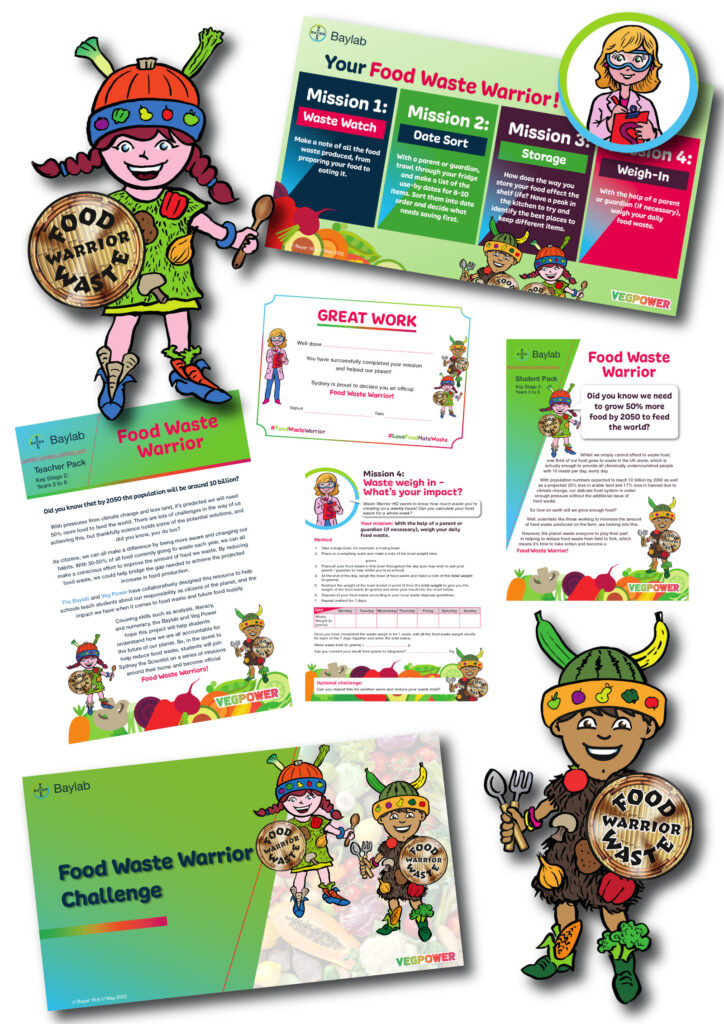
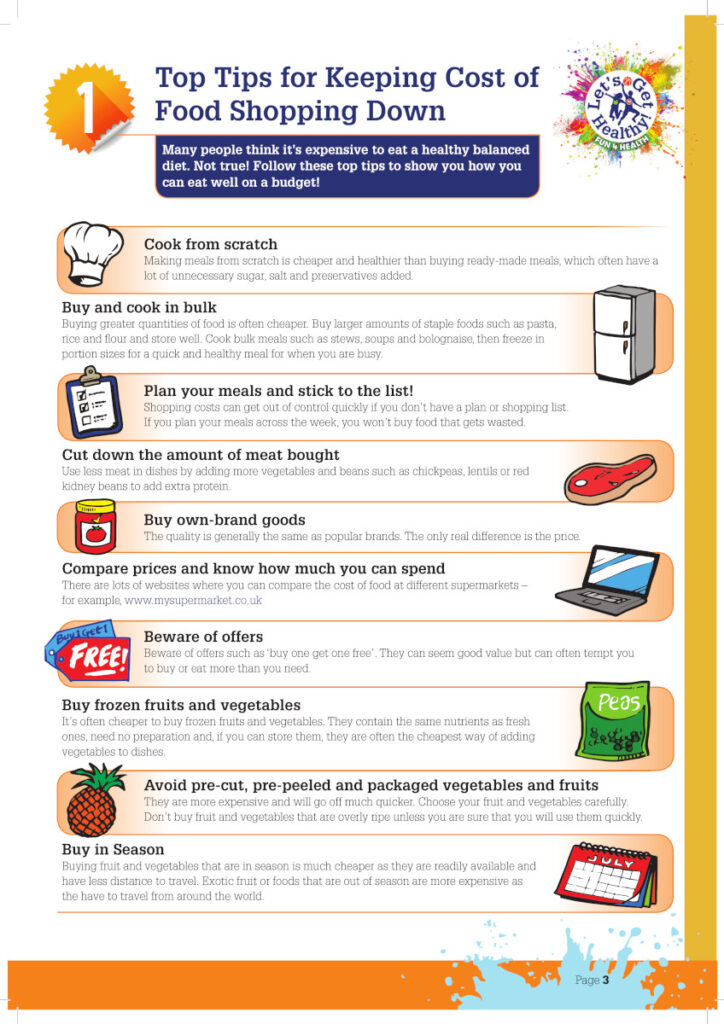
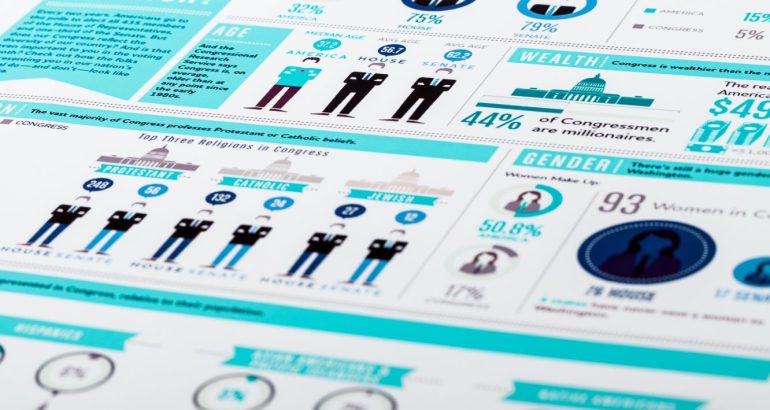
Infographics can be created in a variety of formats, including posters, brochures, and digital media, such as the example below.

It’s not easy to create a compelling infographic design. At Image Box Design, we create infographics that communicate, convert or display data in a visually appealing way.
Looking for a quote, or more information? Get in touch with our experts today and we’ll be happy to help.
Why Use Infographics?
- Infographics can present complex information in a visually appealing and easy-to-understand format
- They are highly shareable on social media platforms, increasing the potential reach of the information
- Infographics can help to engage and captivate an audience, making the information more memorable
- They can be used to simplify data and statistics, making it easier for the audience to comprehend
- Infographics can enhance storytelling and make content more compelling and persuasive
Impact of Infographics
Engagement and Retention
Infographics have a significant impact on engagement and retention. They are visually appealing and can convey complex information in a concise and easy-to-understand manner.
This makes them an effective tool for capturing the attention of the audience and keeping them engaged.
Studies have shown that people are more likely to remember information presented in a visual format than in a text-based format.
Infographics utilise this advantage to present information in a way that is both memorable and engaging. This can lead to increased retention of information and a better understanding of the topic at hand.
Shareability and Virality
Infographics are highly shareable and have the potential to go viral. They are easily shareable on social media platforms and can reach a large audience quickly.
This makes them an effective tool for increasing brand awareness and driving traffic to a website.
Infographics that are visually appealing, informative and shareable can generate a lot of interest and engagement on social media.
This can lead to increased visibility and exposure for a brand or organisation. Additionally, infographics that go viral can generate backlinks, which can improve search engine rankings and drive more traffic to a website.
Examples & Uses of Infographics
- To showcase successful client projects and demonstrate expertise in a particular industry or service
- As a tool for sales and marketing teams to provide real-life examples of how the company’s products or services have benefited clients
- To build credibility and trust with potential clients by providing evidence of past successes
- As a valuable resource for content marketing, providing in-depth analysis and insights into specific challenges and solutions
- To illustrate problem-solving abilities and the impact of the company’s offerings in a tangible and relatable manner
Here are some examples of how infographics may be used within different sectors.
Education
Infographics are an effective way to present complex information in a clear and concise manner.
They can be used to explain difficult concepts, provide visual aids for lectures, and summarise key points. Infographics are also an excellent way to help students remember important information.

Marketing
Infographics are a popular tool in marketing campaigns. They can be used to promote products or services, explain complex information, and highlight the benefits of a particular product or service.
Infographics are also an effective way to increase brand awareness and engagement on social media.
Journalism
Infographics are a valuable tool for journalists. They can be used to present data and statistics in a more engaging and accessible way and to help illustrate complex stories.
Infographics can also be used to explain news events and provide context for current events.
Public Awareness
Infographics are a useful way to raise public awareness about important issues. They can be used to present information about health and safety, environmental issues, and social justice topics.
Infographics are also an effective way to communicate with the public about government policies and initiatives.
Tips on How to Create a Compelling Infographic
High-quality infographics integrate text, images, and data to educate and captivate the audience.
To create infographics that achieve the ideal blend of a great design and information, use these best practices:
- Use lines, borders, and shapes to organise related content.
- Use a single contrasting colour to highlight crucial information.
- Establish a text hierarchy using three distinct font styles.
- Use images, icons, and illustrations to ensure that key points are easily remembered.
How to Create an Infographic
1. Define Your Purpose and audience
Begin with a clear objective – what message do you aim to convey? Determine the goal of your infographic and who your target audience is. Understanding the purpose and the audience will help shape the content and design elements of your infographic.
2. Gather Relevant Information and Data
Collect the necessary information, statistics, and data that you want to present in your infographic. This could include research findings, survey results, or any other relevant data points.
3. Choose a Design Tool
Select a design tool that suits your skill level and needs. There are various options available, ranging from user-friendly online infographic makers to professional design software like Adobe Illustrator or Canva.
Alternatively, you may consider reaching out to a graphic designer to help save time and resources.
4. Create a Layout
Plan the layout of your infographic, considering how you want to organise the information visually. Decide on the sections, the flow of information, and the overall structure of the infographic.
5. Design Visually Appealing Graphics
Incorporate visuals such as icons, illustrations, charts, and images to complement the data and make the infographic visually engaging. Use a consistent colour scheme and style to maintain visual coherence.
6. Craft Compelling Text
Write clear and concise text to accompany the visuals. Use headings, subheadings, and bullet points to make the information easy to digest. Ensure that the text supports and enhances the visual elements.
7. Add Data Visualisation
If your infographic includes data, consider using charts, graphs, or other visual representations to present the information clearly and understandably.
8. Review and Revise
Once the initial design is complete, review the infographic for accuracy, clarity, and overall impact. Make any necessary revisions to improve the content and design.

Different Types of Infographics
Several types of infographics can be used to convey different types of information.
Let’s look at the main types below.
Statistical
Statistical infographics are used to present numerical data and statistics in a visually appealing manner. They often use charts, graphs, and tables to present the data.
Useful for: Presenting trends, comparisons, and relationships between different data sets.
Informational
Informational infographics are used to present information in a visually appealing manner. They often use icons, illustrations, and diagrams to present the information.
Useful for: Presenting facts, figures, and other information in a concise and easy-to-understand format.
Timeline
Timeline infographics are used to present a chronological sequence of events. They often use a linear timeline to show the progression of events over time.
Useful for: presenting historical events, project timelines, and other time-based information.
Process
Process infographics are used to present a series of steps or a process in a visually appealing manner. They often use diagrams, illustrations, and icons to show the different stages of the process.
Useful for: Presenting complex processes in a simple and easy-to-understand format.
Geographic
Geographic infographics are used to present information related to geography or location. They often use maps, charts, and diagrams to present the information.
Useful for: presenting information related to demographics, population, and other location-based data.
Comparison
Comparison infographics are used to present a comparison between two or more things. They often use charts, graphs, and tables to present the information.
Useful for: Presenting the similarities and differences between different data sets or concepts.
Infographic Design by Image Box Design
A well-designed infographic can turn the most mundane data into eye-catching visuals that will make your target audience want to read more.
Not an infographic designer? Not a problem. At Image Box Design, we can help create compelling infographics for any of your business needs.
If you’d like a quote, call us on 0118 969 4000 or complete our online form and we’ll get in touch as soon as possible.
Related Design Guides:
- What is Graphic Design?
- What Makes a Good Poster?
- What is a Brochure?
- What is Logo Design?
- Why Branding is Important for Your Businesses Success
- 10 Signs Your Business Needs a Rebrand
- 7 Reasons Why Typography is Important
- 15 Tips For Choosing The Best Graphic Design Company
- What is Illustration?
- 17+ Reasons Why Graphic Design is Important for Businesses
- How to Make a Magazine


